 Latest images
2024 Regionals By The Numbers
+5
asteroidpig
TheRealCaseyKoller
rsg
Lit-in-Litigation
MockAnalysisIsMyDrug
9 posters

 MockAnalysisIsMyDrug
- Posts : 211
Reputation : 247
Join date : 2019-11-19
2024 Regionals By The Numbers
Sat Nov 25, 2023 12:10 am
At long last, Regional assignments are out, and that means it’s time for some analysis! We will have our week one analysis out as soon as possible, but in the meantime, we have crunched some numbers to bring you our initial thoughts on the difficulty of each Regional.
Different strength breakdowns:
As usual, we can break this down in a lot of different ways:
First, we look at the average rank for each regional. By looking at the average TPR rank, we get a sense of the overall strength. Ranks are the simplest metric for measuring the strength of teams, a lower average rank indicates better teams on the whole. The first column on our chart represents the average rank of the teams at each Regional.
It’s also important to look at how strong the top teams at a tournament are because these are the teams you have to displace if you want to get a bid. Thus, the second column looks at the average rank of the top “n” teams at each Regional, where “n” is the number of bids allocated to that Regional. The important thing to note here is that we don’t know exactly how many bids each Regional is getting this year. We are basing our calculation of “n” on the formula AMTA lays out in their rules, but as teams drop and get added the number of bids will change and AMTA often changes their bid allocation formula at the midyear meeting.
TPR points look at the raw data that AMTA uses to assign ranks (sometimes there are large jumps in rank so this can be a little more accurate). For TPR, we can look at the sum of the TPR for all of the teams there which gives us a sense of the total power at the tournament. Our third column looks at the total number of TPR points present in a region.
We can also look at the average number of TPR points for a team in a region to take into account the fact that different tournaments have different numbers of teams. This looks at how strong the average team at the tournament is. Our fourth column looks at the average TPR points of a team in the region.
Once again, we can use TPR to look at just the average of the top teams. This tells us how much power you have to displace to get a bid. The fifth column looks at the average number of TPR points held by the top “n” teams in a region, where “n” is the number of bids allocated to that Regional.
This year we have added a column that tracks how many ballots each team got at regionals last year. Most of AMTA’s traditional metrics only look at how teams did at ORCS or NCT. But fundamentally, that means that AMTA rates ⅔ of the field as basically fungible. And we all know that there is a big difference in quality between a team that is consistently going 4-4 at regionals and a team that is consistently going 0-8 at regionals, even if neither of them has a TPR.
And finally, we can look at the number of teams from various difficulty levels at each tournament. Our chart shows the number of ranked teams (column H), Top 200 teams (column I), the number of Top 100 teams (column J),the number of Top 50 (column K) teams, and the number of teams that competed at the 2022 NCT(column L) in each region.
We have taken the liberty of color coding our chart so that it’s easy to see where each region stands relative to the rest of the field in each category. Red regions are harder than others in that category. Green regions are easier than others. The darker the red, the harder, the darker the green, the easier.
https://docs.google.com/spreadsheets/d/1RaiABc5zFeFAWctMMYeac9rkLq_PamZ51geNFJ0jIMc/edit?usp=sharing
**A note on C, D, and E teams: since C+ teams can’t get a TPR, but some of them are quite good, we always try and give them a ghost TPR. Below is our formula for ghost TPR:
***A Note on Unranked teams: For each unranked team (A/B teams with no TPR or C+ teams that have not qualified for the last three years), we assigned a TPR score of 0 and a rank of 280.
The MAIMD Official Ranking:
And now, averaging the results from our different ranking methods, we have the official Mock Analysis Regional rankings from most to least difficult:
Williamsburg
Chapel Hill
South Bend
Madison
Fresno
Columbia
Dayton
Des Moines
Spartanburg
Claremont
Washington
Columbus
State College
Chestnut Hill
Tempe
Wheaton
New London
Seattle
Tallahassee
Arlington
Providence
St. Louis
Haverford
Princeton
Norman
San Diego
Jackson
Waco
Buffalo
Colorado Springs
Initial Thoughts on Parity:
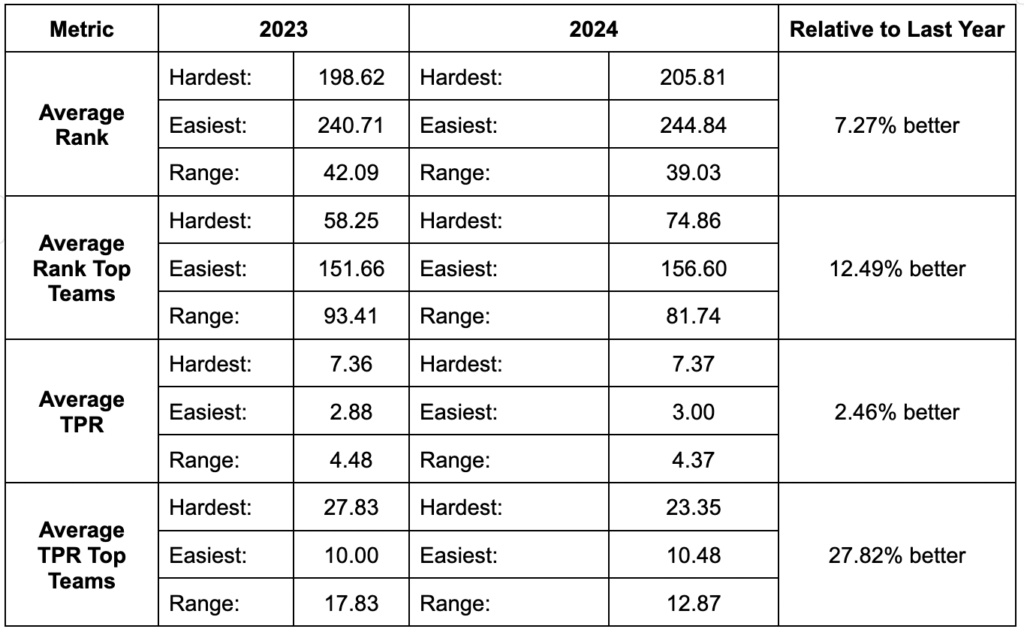
As per usual we have taken a look at the parity between regional and compared it year over year. This year AMTA did better on every metric we track than they did last year. But in most cases the gains were marginal. After two years of wild swings in the parity after COVID, this looks like we are returning to something resembling normalcy with only slight variation year over year.
If anything, the slight improvement we are seeing this year seems like a slow return to non-COVID team counts and non-COVID TPRs. COVID severely reduced AMTA enrollment and the reduction was primarily felt in the number of very weak teams (both teams from weak programs and D, E, and F teams from strong programs). Traditionally, the weaker teams fill out the bottom of every regional. AMTA’s TPR and rank metrics do not differentiate between these teams at all. The more of them there are filling out the bottom of all of the regionals, the less the differences in the ranked teams at the top of the regionals will matter when the whole regional is averaged. So as we see a return to pre-COVID enrollment numbers, the regionals are likely to look more even again.
COVID also demonstrated the lack of parity across the country. Teams that competed in hard regions, consistently failing to bid out of regionals, were able to make it out during COVID– and we noticed a similar pattern at ORCS. So in the years that followed we saw inflated TPRs in the regions that typically have hard regionals and depressed TPRs in the regions which usually have easy regionals. As the COVID years slide off the TPR chart we return to something resembling the pre-COVID numbers. That means that even without changing anything about their assignment methodology, AMTA was likely to see slight improvements across all metrics.
One of the other things that the return to non-Zoom TPR means is that all but the very top TPRs are better for comparison within a geographic region than they are national comparison. At the top end of the field, TPR is basically determined by a team’s performance at nationals, and so we can truly say that it isn’t geographically based. Once you get beyond about the mid-80’s, however, TPR is 100% determined by how you do against the pool at your local ORCS, not some sort of national pool. So if you go to a weak ORCS, a middling TPR is less impressive than a similar TPR produced by a strong ORCS. The result of this geographic disparity is that it is simply harder to compare regionals in very different geographic locations purely based on TPR than it might be if we had a truly national TPR. Clearly, even with geographically skewed TPR, the difference between Williamsburg and Colorado Springs is still obvious. But there may be some regional tilt to some of the closer disparities.
One of the things that makes us most interested in, therefore, is whether there are disparities between regionals that are close enough together to share an ORCS. These share geographically comparable TPRS. And they are often close enough that AMTA can swap teams between them (in a way that one couldn’t, for example, solve power problems in Williamsburg by shipping teams to Colorado Springs). Notably, for instance, you can see pretty close parity between a lot of regionals that have traditionally been considered alternatives for one another. Des Moines and Madison are very similar by our ranking, as are Claremont and Fresno. So far so good.
But we do have to wonder why Claremont is so much harder than San Diego despite both being SoCal regionals. Similarly, we have to wonder why Wheaton is so much easier than Madison or Des Moines (especially considering that it is actually closer to some of the more powerful teams that got sent to the harder regionals). We have to wonder why St. Louis is down at the bottom of the table when Columbus and Dayton (the other two regionals that typically serve the southern Midwest) are up so close to the top. And we have to wonder why Williamsburg is the most difficult regional in the country, when there was a close analogue, Haverford, that is well into the bottom half.
We also wanted to point out something about our newest strength metric, regionals ballots from prior years. This metric was the one that tracked the least well with the other metrics we run. As a result there were mid pack, or even bottom half regionals that had some of the hardest scores on that metric. The first thing this means is that those regionals, while they may not be showing their difficulty at the top, because they are mostly unranked teams, may be harder to slide through than they seem at first glance. If you are a team that is on the cusp of earning a bid, the strength of the teams just below the bid level is more important than the strength of the teams at the very top (and many of those slightly-below-bid-level teams are those without TPRs who get a fair number of ballots at regionals every year).
Finally, we wanted to note that there are some of these regionals that may change significantly between now and February. In particular, there are seven programs with ranked teams that have not yet registered and received team numbers: NYU, Dillard, Air Force, Houston Baptist, Fresno State, Cal Poly Pomona, and Loyola Marymount. Notably, most of these are West Coast, which may add even more power to those regionals (and could balance San Diego with the other West coast regionals if those teams mostly get added there). Meanwhile, Dillard and both NYU teams are not just ranked, but highly ranked. So, if they join late, whatever regional AMTA sends them to will get a huge power boost.
Final Thoughts:
As always, we’d like to note that while these statistics are helpful in understanding the makeup of each Regional, they aren’t definitive. Teams with high TPRs and competitive histories underperform all the time, and teams without particularly competitive histories often surprise us with a breakout season. At the end of the day, we do these writeups to help competitors connect with and understand the AMTA community–not to make anyone feel like they don’t stand a chance because they’ve been assigned the hardest Regional. Take these numbers as an opportunity to understand the field you’re up against, but don’t use them to count yourself out. No TPR or field balance—be it competitive or not—means a thing once you actually step into the well. Good luck to everyone this season!
Different strength breakdowns:
As usual, we can break this down in a lot of different ways:
First, we look at the average rank for each regional. By looking at the average TPR rank, we get a sense of the overall strength. Ranks are the simplest metric for measuring the strength of teams, a lower average rank indicates better teams on the whole. The first column on our chart represents the average rank of the teams at each Regional.
It’s also important to look at how strong the top teams at a tournament are because these are the teams you have to displace if you want to get a bid. Thus, the second column looks at the average rank of the top “n” teams at each Regional, where “n” is the number of bids allocated to that Regional. The important thing to note here is that we don’t know exactly how many bids each Regional is getting this year. We are basing our calculation of “n” on the formula AMTA lays out in their rules, but as teams drop and get added the number of bids will change and AMTA often changes their bid allocation formula at the midyear meeting.
TPR points look at the raw data that AMTA uses to assign ranks (sometimes there are large jumps in rank so this can be a little more accurate). For TPR, we can look at the sum of the TPR for all of the teams there which gives us a sense of the total power at the tournament. Our third column looks at the total number of TPR points present in a region.
We can also look at the average number of TPR points for a team in a region to take into account the fact that different tournaments have different numbers of teams. This looks at how strong the average team at the tournament is. Our fourth column looks at the average TPR points of a team in the region.
Once again, we can use TPR to look at just the average of the top teams. This tells us how much power you have to displace to get a bid. The fifth column looks at the average number of TPR points held by the top “n” teams in a region, where “n” is the number of bids allocated to that Regional.
This year we have added a column that tracks how many ballots each team got at regionals last year. Most of AMTA’s traditional metrics only look at how teams did at ORCS or NCT. But fundamentally, that means that AMTA rates ⅔ of the field as basically fungible. And we all know that there is a big difference in quality between a team that is consistently going 4-4 at regionals and a team that is consistently going 0-8 at regionals, even if neither of them has a TPR.
And finally, we can look at the number of teams from various difficulty levels at each tournament. Our chart shows the number of ranked teams (column H), Top 200 teams (column I), the number of Top 100 teams (column J),the number of Top 50 (column K) teams, and the number of teams that competed at the 2022 NCT(column L) in each region.
We have taken the liberty of color coding our chart so that it’s easy to see where each region stands relative to the rest of the field in each category. Red regions are harder than others in that category. Green regions are easier than others. The darker the red, the harder, the darker the green, the easier.
https://docs.google.com/spreadsheets/d/1RaiABc5zFeFAWctMMYeac9rkLq_PamZ51geNFJ0jIMc/edit?usp=sharing
**A note on C, D, and E teams: since C+ teams can’t get a TPR, but some of them are quite good, we always try and give them a ghost TPR. Below is our formula for ghost TPR:
| Most Recent Year With Enough Bids | 2023 | 2022 | 2021 | None In The Last Three |
| C team | (B TPR)/2 | (B TPR)/4 | (B TPR)/8 | 0 |
| D team | (B TPR)/4 | (B TPR)/8 | (B TPR)/16 | 0 |
| E team | (B TPR)/8 | (B TPR)/16 | (B TPR)/32 | 0 |
The MAIMD Official Ranking:
And now, averaging the results from our different ranking methods, we have the official Mock Analysis Regional rankings from most to least difficult:
Williamsburg
Chapel Hill
South Bend
Madison
Fresno
Columbia
Dayton
Des Moines
Spartanburg
Claremont
Washington
Columbus
State College
Chestnut Hill
Tempe
Wheaton
New London
Seattle
Tallahassee
Arlington
Providence
St. Louis
Haverford
Princeton
Norman
San Diego
Jackson
Waco
Buffalo
Colorado Springs
Initial Thoughts on Parity:
As per usual we have taken a look at the parity between regional and compared it year over year. This year AMTA did better on every metric we track than they did last year. But in most cases the gains were marginal. After two years of wild swings in the parity after COVID, this looks like we are returning to something resembling normalcy with only slight variation year over year.
If anything, the slight improvement we are seeing this year seems like a slow return to non-COVID team counts and non-COVID TPRs. COVID severely reduced AMTA enrollment and the reduction was primarily felt in the number of very weak teams (both teams from weak programs and D, E, and F teams from strong programs). Traditionally, the weaker teams fill out the bottom of every regional. AMTA’s TPR and rank metrics do not differentiate between these teams at all. The more of them there are filling out the bottom of all of the regionals, the less the differences in the ranked teams at the top of the regionals will matter when the whole regional is averaged. So as we see a return to pre-COVID enrollment numbers, the regionals are likely to look more even again.
COVID also demonstrated the lack of parity across the country. Teams that competed in hard regions, consistently failing to bid out of regionals, were able to make it out during COVID– and we noticed a similar pattern at ORCS. So in the years that followed we saw inflated TPRs in the regions that typically have hard regionals and depressed TPRs in the regions which usually have easy regionals. As the COVID years slide off the TPR chart we return to something resembling the pre-COVID numbers. That means that even without changing anything about their assignment methodology, AMTA was likely to see slight improvements across all metrics.
One of the other things that the return to non-Zoom TPR means is that all but the very top TPRs are better for comparison within a geographic region than they are national comparison. At the top end of the field, TPR is basically determined by a team’s performance at nationals, and so we can truly say that it isn’t geographically based. Once you get beyond about the mid-80’s, however, TPR is 100% determined by how you do against the pool at your local ORCS, not some sort of national pool. So if you go to a weak ORCS, a middling TPR is less impressive than a similar TPR produced by a strong ORCS. The result of this geographic disparity is that it is simply harder to compare regionals in very different geographic locations purely based on TPR than it might be if we had a truly national TPR. Clearly, even with geographically skewed TPR, the difference between Williamsburg and Colorado Springs is still obvious. But there may be some regional tilt to some of the closer disparities.
One of the things that makes us most interested in, therefore, is whether there are disparities between regionals that are close enough together to share an ORCS. These share geographically comparable TPRS. And they are often close enough that AMTA can swap teams between them (in a way that one couldn’t, for example, solve power problems in Williamsburg by shipping teams to Colorado Springs). Notably, for instance, you can see pretty close parity between a lot of regionals that have traditionally been considered alternatives for one another. Des Moines and Madison are very similar by our ranking, as are Claremont and Fresno. So far so good.
But we do have to wonder why Claremont is so much harder than San Diego despite both being SoCal regionals. Similarly, we have to wonder why Wheaton is so much easier than Madison or Des Moines (especially considering that it is actually closer to some of the more powerful teams that got sent to the harder regionals). We have to wonder why St. Louis is down at the bottom of the table when Columbus and Dayton (the other two regionals that typically serve the southern Midwest) are up so close to the top. And we have to wonder why Williamsburg is the most difficult regional in the country, when there was a close analogue, Haverford, that is well into the bottom half.
We also wanted to point out something about our newest strength metric, regionals ballots from prior years. This metric was the one that tracked the least well with the other metrics we run. As a result there were mid pack, or even bottom half regionals that had some of the hardest scores on that metric. The first thing this means is that those regionals, while they may not be showing their difficulty at the top, because they are mostly unranked teams, may be harder to slide through than they seem at first glance. If you are a team that is on the cusp of earning a bid, the strength of the teams just below the bid level is more important than the strength of the teams at the very top (and many of those slightly-below-bid-level teams are those without TPRs who get a fair number of ballots at regionals every year).
Finally, we wanted to note that there are some of these regionals that may change significantly between now and February. In particular, there are seven programs with ranked teams that have not yet registered and received team numbers: NYU, Dillard, Air Force, Houston Baptist, Fresno State, Cal Poly Pomona, and Loyola Marymount. Notably, most of these are West Coast, which may add even more power to those regionals (and could balance San Diego with the other West coast regionals if those teams mostly get added there). Meanwhile, Dillard and both NYU teams are not just ranked, but highly ranked. So, if they join late, whatever regional AMTA sends them to will get a huge power boost.
Final Thoughts:
As always, we’d like to note that while these statistics are helpful in understanding the makeup of each Regional, they aren’t definitive. Teams with high TPRs and competitive histories underperform all the time, and teams without particularly competitive histories often surprise us with a breakout season. At the end of the day, we do these writeups to help competitors connect with and understand the AMTA community–not to make anyone feel like they don’t stand a chance because they’ve been assigned the hardest Regional. Take these numbers as an opportunity to understand the field you’re up against, but don’t use them to count yourself out. No TPR or field balance—be it competitive or not—means a thing once you actually step into the well. Good luck to everyone this season!
TarotReaders likes this post
- Lit-in-Litigation
- Posts : 1
Reputation : 0
Join date : 2023-11-25
Re: 2024 Regionals By The Numbers
Sat Nov 25, 2023 11:09 am
Houston Baptist changed their name to Houston Christian this year. They may be registered under that.
- rsg
- Posts : 2
Reputation : 0
Join date : 2023-01-26
Re: 2024 Regionals By The Numbers
Sat Nov 25, 2023 6:47 pm
awesome sauce
- MockAnalysisIsMyDrug
- Posts : 211
Reputation : 247
Join date : 2019-11-19
Re: 2024 Regionals By The Numbers
Mon Nov 27, 2023 12:29 pm
Lit-in-Litigation wrote:Houston Baptist changed their name to Houston Christian this year. They may be registered under that.
Thanks for catching that! we have updated the spreadsheet. That moves the Waco regional from #28 to #25!
- TheRealCaseyKoller
- Posts : 3
Reputation : 0
Join date : 2023-02-08
Re: 2024 Regionals By The Numbers
Sat Dec 16, 2023 11:34 pm
just a head's up: NYU registered for regionals and is now at Buffalo
- MockAnalysisIsMyDrug
- Posts : 211
Reputation : 247
Join date : 2019-11-19
Re: 2024 Regionals By The Numbers
Sun Dec 17, 2023 2:06 pm
Yep! we have been updating the sheet every few days as new teams register and will continue to do so periodically between now and regionals.
- MockAnalysisIsMyDrug
- Posts : 211
Reputation : 247
Join date : 2019-11-19
Re: 2024 Regionals By The Numbers
Sat Feb 03, 2024 2:23 pm
Usually we don’t post an addendum to our By the Numbers post this close to Regionals, but there’s been a development that really changes things up and we feel is worth commenting on. AMTA is allocating fewer bids per tournament than we understood their rules to allocate –and this could end up shaking up the power at some of the regionals.
To catch you up on how AMTA typically decides bid allocation, AMTA rule 12.5(2) states:
Very simply, they divide the number of bids by the number of tournaments. Then they give bigger tournaments one extra bid until they run out of bids.
This year, there are 192 bids to ORCS. There are 30 regionals. The “Baseline” number is 6. There are five “mini-regionals” that get a reduced number of bids to account for their smaller fields (Seattle and Waco are slated for 5 right now, Arlington and Tempe get 4, and Colorado Springs gets 3). Giving all non-mini regionals 6 bids leaves 21 unclaimed bids. So we predicted, based on rule 12.5, that the biggest 21 regionals would be getting an extra bid. As of the time of posting there are 20 regionals with 22+ teams. So we expected all of those regionals to have 7 bids (leaving just one open bid).
The regionals that we expected to have 7 bids are as follows (listed by size):
Providence-28
Princeton-27
Williamsburg-26
Spartanburg-26
Tallahassee-26
St. Louis-26
Chestnut Hill-25
Washington-25
Wheaton-25
Jackson-25
Dayton-24
Columbia-24
Des Moines-24
Fresno-24
Buffalo-24
Haverford-24
New London-24
Madison-23
Columbus-23
Chapel Hill-22
But AMTA has been announcing at opening ceremonies that all Week 1 Regionals (including ones we expected to qualify for that 7th bid by having greater than 22 teams competing) will only have 6 bids. So far every week one Regional we have eyes on has been allocated six bids (including the larger ones). And on AMTA’s official online allocation, they are giving every regional except Providence and Princeton 6 bids. You can see that here: https://www.collegemocktrial.org/tournaments-/opening-round-championship-/orcs-earned-bid-list/
This means that the following regionals will each have one fewer bid than we expected: Williamsburg, Spartanburg, Tallahassee, St. Louis, Chestnut Hill, Washington, Wheaton, Jackson, Dayton, Columbia, Des Moines, Fresno, Buffalo, Haverford, New London, Madison, Columbus, Chapel Hill
This makes a difference to our By the Numbers calculations. So here is our old chart with the number of bids we predicted based on Rule 12.5 (updated with all the new adds and drops): https://docs.google.com/spreadsheets/d/1RaiABc5zFeFAWctMMYeac9rkLq_PamZ51geNFJ0jIMc/edit#gid=0
But here is the chart with the number of bids AMTA is giving out according to their official allocation: https://docs.google.com/spreadsheets/d/1nNXSo0wKxh0T9P6e_gYP-K5gGitX-2SdQ6PJ6v3idZI/edit?usp=sharing
Now you might be thinking, “sure, this is a bit wonky, but why does it matter?” After all, the bids not given out will just end up being open bids. Here are a couple reasons why it does:
First, this shifts the power balance of the regionals. Yes, there are the same number of bids total, but normally those bids are reserved to certain Regionals. Fundamentally, what the new allocation does is take bids away from certain Regionals and then make them free for teams from any regional. So teams at the affected Regionals (i.e., the ones that we predicted to have 7 bids and will only have 6) have less access to bids than they otherwise would. And the teams from the unaffected regionals have more access to bids than they otherwise would. Since we are a numbers based operation, we think this is important to keep tabs on.
Second, this will make round four more difficult for underdogs at the affected regionals. One of the things we saw the last time AMTA lowered the number of bids at a tournament (in 2019 when ORCS only had five bids), is that the reduced number of bids affects the high-low pairings in round four. In round 4, AMTA separates out all of the teams that are out of the running for a bid into their own bracket. They do this by finding out which teams would bid if the tournament ended right then and then putting all of the teams that are more than two ballots behind the lowest bid earning team into the “out bracket” the teams that are not in the “out bracket” are still fighting for bids in the “in bracket” and they are power matched high low.
Adding an extra bid can often mean that the record required to stay in the “in bracket” is lower (because worst bidding record -2 is lower). So the “in bracket” is bigger and encompasses a wider range of teams. This matters. If the “in bracket” encompasses everyone with 2+ ballots, then the 2 ballot teams will play the 6 ballot teams and 3 and 4 ballot teams are likely to be hitting each other. This means that teams with 3 ballots going into round four have a very realistic chance of clawing their way to 5 ballots (which usually means an open bid). If the “in bracket” is smaller, then 3 and 4 ballot teams may find themselves facing 5 and 6 ballot teams, and in a much stickier position. This increases the risks of dropping an unlucky ballot or two early.
TLDR here: not only are teams going into Regionals with fewer bids up for grabs, but many of the cusp teams that have the potential to be Cinderellas in a normal year will be looking at a harder schedule.
As of the time of posting, it isn’t entirely clear what has caused this discrepancy. It is possible that they are planning on adding the extra bids back in after a few rounds, once the number of teams per regional is finalized (and we account for last minute drop outs) or there is something that we’re missing. Nothing will be final until they pair the first round 4 of Week 1, which should happen sometime Sunday afternoon. We hope they resolve this by adding the extra bids sometime this weekend or at least some clarity on why things are different this year.
To catch you up on how AMTA typically decides bid allocation, AMTA rule 12.5(2) states:
The total number of bids to the Opening Round Championship Series, as determined per Rule 12.5(1), shall be divided by the total number of Regional tournaments, with the resulting number being designated as the "Baseline" number of bids allocated to each Regional tournament. If the division of total bids by total number of Regional tournaments does not result in a whole number, the result shall be rounded down to the nearest whole number. Unless otherwise adjusted in accordance with subsections (a) and (b) below, all Regional tournaments shall receive the "Baseline" number of bids to the designated Opening Round Championship Series tournament(s).
Should the number of Regionals not allow for equal distribution of the bids, each Regional shall receive the same number of bids, as outlined in Rule 12.5(2) above, and the remainder shall be distributed jointly by the National Tabulation Director and the Tournament Administration Committee Chair as follows: Regionals with 20 or more bid-eligible teams will be ranked according to the number of teams registered 48 hours prior to the start of the first Regional, from largest to smallest. The unassigned bids will be allocated beginning with the largest Regional tournament. If not all Regional tournaments with the same number of teams can be logistically accommodated, those bids will remain open bids. The number of bids allocated to each Regional will be confirmed at the time of each Regional tournament's registration based upon the number of teams that actually begin in Round 1. If the number of registered teams necessitates a change in the number of ORCS bids assigned, the AMTA Representatives, in consultation with the National Tabulation Director, will announce such at the Opening Ceremony. If team(s) withdraw from a Regional tournament during or after Round 1 begins, the number of bids will not be affected. If a bid is removed from a Regional, that bid shall become an Open Bid. If the National Tabulation Director has good reason to believe a team that will be unable to compete in Round 1 will still compete in the remaining rounds of the Regional tournament, then the National Tabulation Director has discretion to consider that team to be present at the Regional for purposes of assigning Opening Round Championship Series bids.
Very simply, they divide the number of bids by the number of tournaments. Then they give bigger tournaments one extra bid until they run out of bids.
This year, there are 192 bids to ORCS. There are 30 regionals. The “Baseline” number is 6. There are five “mini-regionals” that get a reduced number of bids to account for their smaller fields (Seattle and Waco are slated for 5 right now, Arlington and Tempe get 4, and Colorado Springs gets 3). Giving all non-mini regionals 6 bids leaves 21 unclaimed bids. So we predicted, based on rule 12.5, that the biggest 21 regionals would be getting an extra bid. As of the time of posting there are 20 regionals with 22+ teams. So we expected all of those regionals to have 7 bids (leaving just one open bid).
The regionals that we expected to have 7 bids are as follows (listed by size):
Providence-28
Princeton-27
Williamsburg-26
Spartanburg-26
Tallahassee-26
St. Louis-26
Chestnut Hill-25
Washington-25
Wheaton-25
Jackson-25
Dayton-24
Columbia-24
Des Moines-24
Fresno-24
Buffalo-24
Haverford-24
New London-24
Madison-23
Columbus-23
Chapel Hill-22
But AMTA has been announcing at opening ceremonies that all Week 1 Regionals (including ones we expected to qualify for that 7th bid by having greater than 22 teams competing) will only have 6 bids. So far every week one Regional we have eyes on has been allocated six bids (including the larger ones). And on AMTA’s official online allocation, they are giving every regional except Providence and Princeton 6 bids. You can see that here: https://www.collegemocktrial.org/tournaments-/opening-round-championship-/orcs-earned-bid-list/
This means that the following regionals will each have one fewer bid than we expected: Williamsburg, Spartanburg, Tallahassee, St. Louis, Chestnut Hill, Washington, Wheaton, Jackson, Dayton, Columbia, Des Moines, Fresno, Buffalo, Haverford, New London, Madison, Columbus, Chapel Hill
This makes a difference to our By the Numbers calculations. So here is our old chart with the number of bids we predicted based on Rule 12.5 (updated with all the new adds and drops): https://docs.google.com/spreadsheets/d/1RaiABc5zFeFAWctMMYeac9rkLq_PamZ51geNFJ0jIMc/edit#gid=0
But here is the chart with the number of bids AMTA is giving out according to their official allocation: https://docs.google.com/spreadsheets/d/1nNXSo0wKxh0T9P6e_gYP-K5gGitX-2SdQ6PJ6v3idZI/edit?usp=sharing
Now you might be thinking, “sure, this is a bit wonky, but why does it matter?” After all, the bids not given out will just end up being open bids. Here are a couple reasons why it does:
First, this shifts the power balance of the regionals. Yes, there are the same number of bids total, but normally those bids are reserved to certain Regionals. Fundamentally, what the new allocation does is take bids away from certain Regionals and then make them free for teams from any regional. So teams at the affected Regionals (i.e., the ones that we predicted to have 7 bids and will only have 6) have less access to bids than they otherwise would. And the teams from the unaffected regionals have more access to bids than they otherwise would. Since we are a numbers based operation, we think this is important to keep tabs on.
Second, this will make round four more difficult for underdogs at the affected regionals. One of the things we saw the last time AMTA lowered the number of bids at a tournament (in 2019 when ORCS only had five bids), is that the reduced number of bids affects the high-low pairings in round four. In round 4, AMTA separates out all of the teams that are out of the running for a bid into their own bracket. They do this by finding out which teams would bid if the tournament ended right then and then putting all of the teams that are more than two ballots behind the lowest bid earning team into the “out bracket” the teams that are not in the “out bracket” are still fighting for bids in the “in bracket” and they are power matched high low.
Adding an extra bid can often mean that the record required to stay in the “in bracket” is lower (because worst bidding record -2 is lower). So the “in bracket” is bigger and encompasses a wider range of teams. This matters. If the “in bracket” encompasses everyone with 2+ ballots, then the 2 ballot teams will play the 6 ballot teams and 3 and 4 ballot teams are likely to be hitting each other. This means that teams with 3 ballots going into round four have a very realistic chance of clawing their way to 5 ballots (which usually means an open bid). If the “in bracket” is smaller, then 3 and 4 ballot teams may find themselves facing 5 and 6 ballot teams, and in a much stickier position. This increases the risks of dropping an unlucky ballot or two early.
TLDR here: not only are teams going into Regionals with fewer bids up for grabs, but many of the cusp teams that have the potential to be Cinderellas in a normal year will be looking at a harder schedule.
As of the time of posting, it isn’t entirely clear what has caused this discrepancy. It is possible that they are planning on adding the extra bids back in after a few rounds, once the number of teams per regional is finalized (and we account for last minute drop outs) or there is something that we’re missing. Nothing will be final until they pair the first round 4 of Week 1, which should happen sometime Sunday afternoon. We hope they resolve this by adding the extra bids sometime this weekend or at least some clarity on why things are different this year.
- asteroidpig
- Posts : 4
Reputation : 0
Join date : 2022-07-07
Re: 2024 Regionals By The Numbers
Sat Feb 03, 2024 3:12 pm
You are forgetting the financial element here. Even if we assumed that all of the bids that are taken away regionals as direct bids will be given to teams from the same regionals as open bids (not gonna happen but whatever), those teams would still be in a worse position. Instead of bidding immediately and knowing they are advancing, they will be kept waiting until the week after the last regional. This means they can’t book hotels or travel until later which will raise the costs. It may also mean they have to travel farther because open bid teams are often asked to go to an ORCS that is not the nearest one to them.
- TheRealMockProdigy
- Posts : 83
Reputation : 99
Join date : 2019-11-25
Re: 2024 Regionals By The Numbers
Sat Feb 03, 2024 3:27 pm
The bit of the rule that you've missed here is "If not all Regional tournaments with the same number of teams can be logistically accommodated, those bids will remain open bids." This happens basically every year -- there are more ORCS places than bids from regionals. Unless a regional gets to 27 or 28 teams, AMTA generally doesn't allocate an extra bid to a regional. This is not a change from how things have been run in previous years.
- The_Quibbler
- Posts : 9
Reputation : 11
Join date : 2019-12-04
Re: 2024 Regionals By The Numbers
Sat Feb 03, 2024 3:54 pm
TheRealMockProdigy wrote:The bit of the rule that you've missed here is "If not all Regional tournaments with the same number of teams can be logistically accommodated, those bids will remain open bids." This happens basically every year -- there are more ORCS places than bids from regionals. Unless a regional gets to 27 or 28 teams, AMTA generally doesn't allocate an extra bid to a regional. This is not a change from how things have been run in previous years.
I don't think this is right. That just means that if they hit a point where like there are x bids left to allocate, all 23+ regionals have been given the extra bid, and there are x+1 regionals with 22 teams, then none of the 22 team regionals get extra bids. Basically, if you can't give all the 22 team regionals extra bids, you don't give any 22 team regionals extra bids. But you give all the 23+ regionals extra bids. But this year there are plenty of bids for ALL of the teams with 22+ to have extra bids given out. The rules say they are supposed to do that.
- BartTheFish
- Posts : 7
Reputation : 15
Join date : 2019-11-28
Re: 2024 Regionals By The Numbers
Sat Feb 03, 2024 3:56 pm
Also like………..there is just the fact that AMTA should follow their own rules.
Like I don’t like the current bid system. I think the bids should be more proportional. But if they say they are going to use one system they should use it. This is a real bait and switch for teams from the mid-size regionals.
Like I don’t like the current bid system. I think the bids should be more proportional. But if they say they are going to use one system they should use it. This is a real bait and switch for teams from the mid-size regionals.
- WashedUpAlum
- Posts : 4
Reputation : 0
Join date : 2022-07-08
Re: 2024 Regionals By The Numbers
Sat Feb 03, 2024 4:32 pm
IDK if this is a bright side or not, but this also hurts B teams from big programs and helps A teams from smaller programs. Because for direct bids, everyone has the same chance of earning a bid. But once bids are being given out as open bids, A teams are given priority. So more open bids always helps A teams and hurts B teams.
But I would be absolutely furious if I was the first honorable mention from one of the regionals that was supposed to get 7 bids.
Do we know why they did this?
But I would be absolutely furious if I was the first honorable mention from one of the regionals that was supposed to get 7 bids.
Do we know why they did this?
- TheRealMockProdigy
- Posts : 83
Reputation : 99
Join date : 2019-11-25
Re: 2024 Regionals By The Numbers
Sat Feb 03, 2024 5:51 pm
I encourage everyone who is mad about this to go back at previous years and look at the numbers of bids AMTA gave out at regionals with teams in the low 20s -- it was 6. This is not a bait and switch and it is not a change from previous years. You should always assume that there will be 6 bids, unless you have fewer than 20 teams (in which case you can calculate the number of bids using the table in the rulebook). I think the rule is written in a confusing way, but this practice is fully in keeping with the way AMTA has run its regionals for many years.
- BartTheFish
- Posts : 7
Reputation : 15
Join date : 2019-11-28
Re: 2024 Regionals By The Numbers
Sat Feb 03, 2024 6:49 pm
Not to be too obnoxious about this, but if this is something that's been happening for years (I haven't gone back and run all the numbers for past years), doesn't that just mean AMTA has been ignoring their rulebook for years and MAIMD just didn't catch them at it? Like AMTA breaking the rules a lot seems worse to me, not better?
I don't think the rules are "confusing" at all. If AMTA doesn't want to follow them, maybe they should change them instead of just being like "welp, we've broken them in the past and nobody noticed. Let's just keep on doing it."
I don't think the rules are "confusing" at all. If AMTA doesn't want to follow them, maybe they should change them instead of just being like "welp, we've broken them in the past and nobody noticed. Let's just keep on doing it."
- BartTheFish
- Posts : 7
Reputation : 15
Join date : 2019-11-28
Re: 2024 Regionals By The Numbers
Thu Feb 29, 2024 3:44 pm
Ok so I went to check on what happened to the teams that should have gotten bids and didn’t. Many of them ended up just getting an open bid to the same ORCS that they would have gone to anyway. Some of them were teams from programs that ended up getting two or more other bids, so their bid would have been eliminated anyway.
But there are some teams that are suffering as a result of this decision by AMTA not to follow their own rules, and if I was on one of those teams, I would be pretty angry.
-From Buffalo, NYU is getting sent to Geneva, 13 hours away (I assume this means they will have to pay for flights). On paper, this matters the least because If AMTA had given the correct number of bids, they would be feeding to Cincinnati, which I assume they would still have to fly to. On the other hand, AMTA was willing to move NYU’s direct bid from Cincinnati to New Rochelle, so maybe, if they had gotten two direct bids both would have been moved.
-From St. Louis, the University of Missouri is driving to St. Paul which is 7.5 hours away from them. If AMTA had given the correct number of bids, they would be feeding to Geneva which is 6 hours away or Memphis which is 5.5 hours away.
-From Columbus, Ohio University is being sent to Washington DC, which is 5.75 hours away. If AMTA had given the correct number of bids, they would be feeding to Cincinnati which would have kept them 2.5 hours away and in state.
-From Chapel Hill, Patrick Henry B is being sent to Memphis, which is 13 hours away (I assume this means they will have to pay for flights). If AMTA had given the correct number of bids, they would be feeding to either Washington D.C., which is 30 minutes away for them, or Greenville, which is 7.5 hours away (so still within driving range) and is where their A team is going.
-From Columbia, High Point is going to St. Paul which is 17 hours away (I assume this means they will have to pay for flights). If AMTA had given the correct number of bids, they would be feeding to Greenville which is 3 hours away.
-From Williamsburg, if AMTA had given the correct number of bids, North Carolina would have a direct bid to Washington DC, 4.5 hours away. But North Carolina had to decline their bids. We don’t know exactly why.
I think the real tragedy here is North Carolina. If the speculation on one of the other threads here is true that they had to decline their open bids because the open bids offered were too far away, or if the open bids being offered a week later than the direct bids made them have to decline, or, frankly, any scenario where they would have been able to accept the direct bids, then AMTA’s laxity about their own rules directly cost UNC a bid. That strikes me as really unfair.
Permissions in this forum:
You cannot reply to topics in this forum|
|
|